


Forensic Eyes Limited, led by Suzanne Costello, is a UK-based consultancy specializing in failure analysis investigations, technical consultancy, and training for the electronics industry. With a focus that spans from semiconductor die-level faults to full product-level failures, the company applies in-depth materials knowledge and advanced analytical techniques to uncover the root causes of electronics issues. In 2025, Forensic Eyes adopted the TAGARNO ZIP digital microscope, a decision that has since transformed their investigative work, client communication, and educational delivery. We recently spoke with Costello to find out more about the partnership with TAGARNO and how the ZIP microscope has benefited the company.
INTERVIEW
Forensic Eyes Transforms Failure Analysis and Training with TAGARNO ZIP
What happens when a leading electronics consultancy adopts a powerful digital microscope? Forensic Eyes Limited shares how the TAGARNO ZIP reshaped their failure analysis, client interactions, and training.
What first led you to explore the TAGARNO ZIP, and what were your initial expectations?
We originally acquired the TAGARNO ZIP in March 2025 as a portable solution for on-site visits. We were looking for something lightweight, quick to set up, and capable of delivering high-quality images during fieldwork. What we didn’t anticipate was how quickly it would become our go-to microscope, not just in the field, but also in our main lab and training sessions. It’s become indispensable.
What features of the ZIP have made the biggest impact on your daily workflow?
The ease of setup and intuitive controls stand out immediately. We’re up and running within minutes, which is invaluable during site visits or customer consultations. But what’s made the biggest difference overall is how efficiently we can capture and share images. We can snip screenshots directly into reports or presentations, eliminating multiple steps from our previous workflow. That alone has significantly increased our productivity.

Founded by Suzanne Costello, Forensic Eyes Limited is a UK-based consultancy and laboratory dedicated to failure analysis, training, and advisory services for the electronics industry.
How digital microscopes improves how you collaborate
Using a monitor to display your magnified samples, or sharing the live image in online meetings, truly transform how you collaborate internally and across teams.
How has the ZIP changed the way you work with clients, especially when explaining failure analysis results?
A huge part of failure analysis is communication – helping clients understand where the failure occurred and why. Often, we’re working with SEM images or high-magnification techniques, and without context, these can be difficult for clients to interpret. The ZIP solves that. It lets us show an entire cross-section live on screen and then zoom into areas of interest. That visual clarity helps clients connect the dots between microscopic features and real-world components. It’s meant fewer follow-ups, faster answers, and more confidence in our findings.
The ability to go from an overview of a component to a pinpoint crack or fault live, and with the client watching, is incredibly powerful. It’s changed the way we communicate technical insights.
Can you share any specific case examples where the ZIP proved especially useful?
Absolutely. One great example was during a wafer handling and die selection investigation. We used the ZIP to identify signs of mechanical stress, surface contamination, and minor misalignments that were leading to pick-and-place issues. The large working distance meant we could physically interact with the sample under magnification, removing or adjusting dies in real-time while keeping everything in view.
In another case, we used the ZIP during a failure analysis of a semiconductor package. We could show the full package cross-section and then zoom in on specific delamination areas. That level of context helped our client immediately understand the root cause.
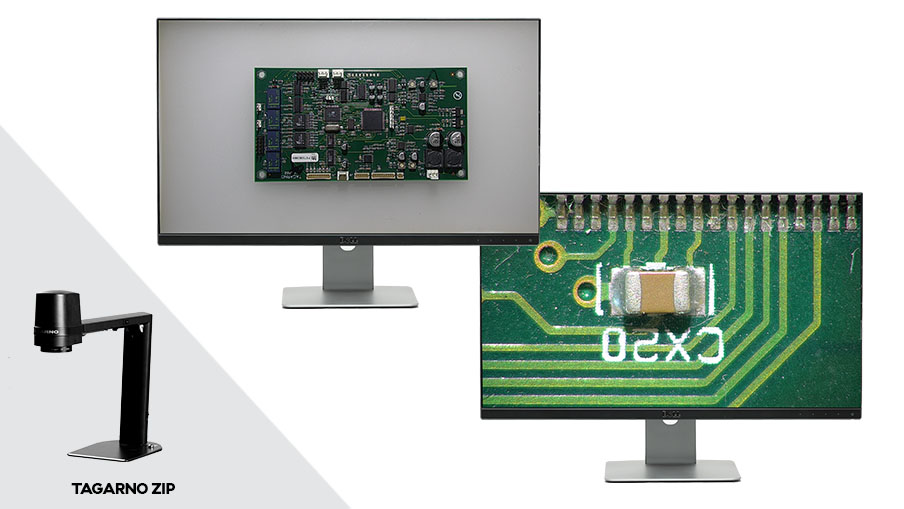
With the ability to show entire cross-sections on screen and zoom in on features of interest in real time, the ZIP provides the contextual clarity needed to understand root causes – and the confidence to act on findings – resulting in fewer follow-ups, faster decision-making, and more effective troubleshooting.
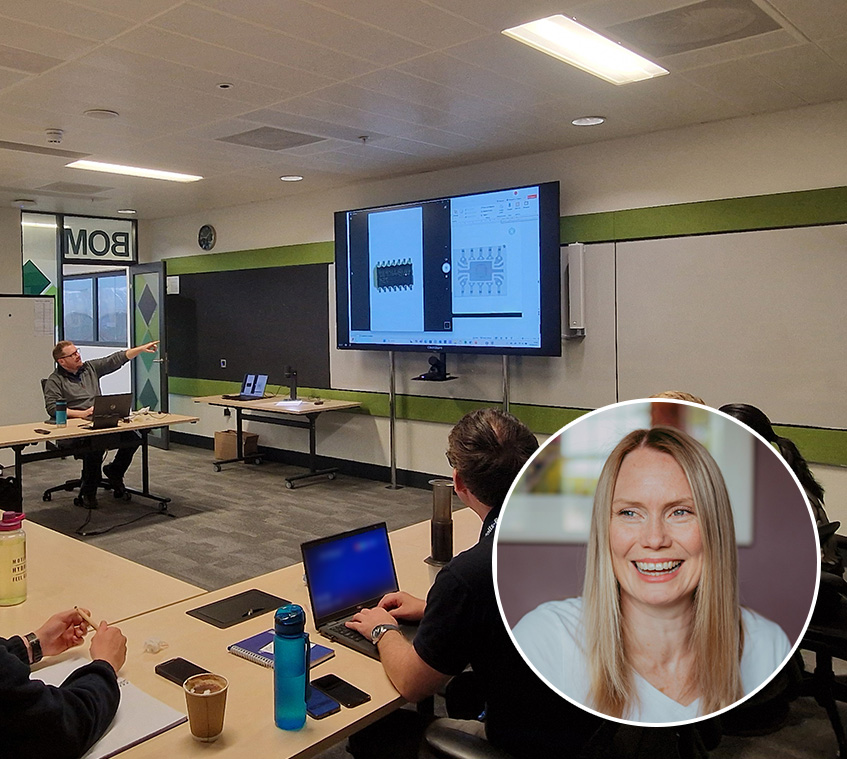
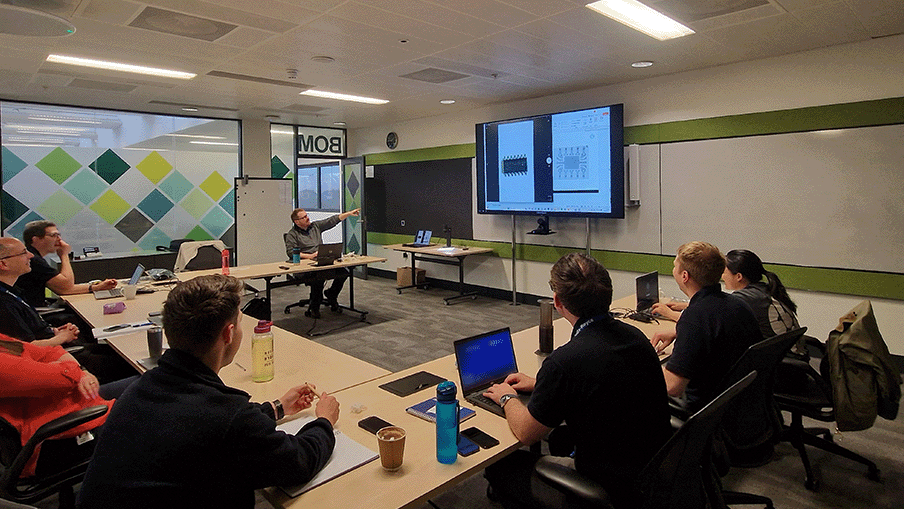
What role does the ZIP play in your training programs?
It’s been a complete game changer. We deliver practical training that combines classroom learning with lab-based analysis. Previously, it was hard to get everyone looking at the same feature under a microscope. Now, before we even touch the sample in the lab, we can do a live walkthrough as a group using the ZIP. That prepares everyone more thoroughly and creates more engagement right from the start.
The ZIP has made our training sessions more interactive and impactful. Trainees love seeing their own polishing and prep work up on the screen. It gives them a real sense of ownership.
Have you noticed any benefits in terms of customer collaboration or remote support?
Definitely. The ZIP makes it easy to let customers guide the analysis. Because the interface is so user-friendly, they can point out what they’re concerned about, and we can focus on those regions in real time. It’s especially valuable for remote support. We can livestream the view under the scope, zoom in and out as needed, and provide immediate feedback with visual clarity.
Founded by Suzanne Costello, Forensic Eyes Limited is a UK-based consultancy and laboratory dedicated to failure analysis, training, and advisory services for the electronics industry.
What would you say to other labs or engineering teams considering digital microscopy, especially the TAGARNO ZIP?
I’d say not to underestimate the value of a tool that simplifies your workflow while enhancing how you engage with your clients. The ZIP isn’t just a microscope: it’s a communication tool, a training aid, and an efficiency booster. We didn’t know we needed it until we started using it, and now we wouldn’t be without it.
The TAGARNO ZIP has transformed the way we work. It’s fast, intuitive, and makes our findings crystal clear to the people who need to act on them.
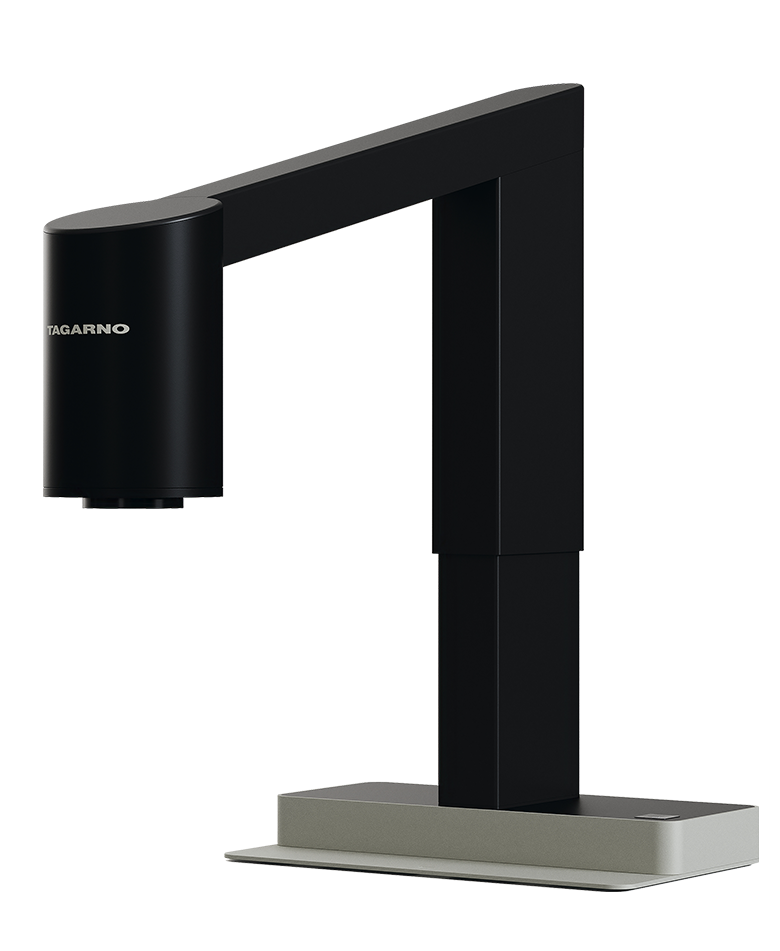
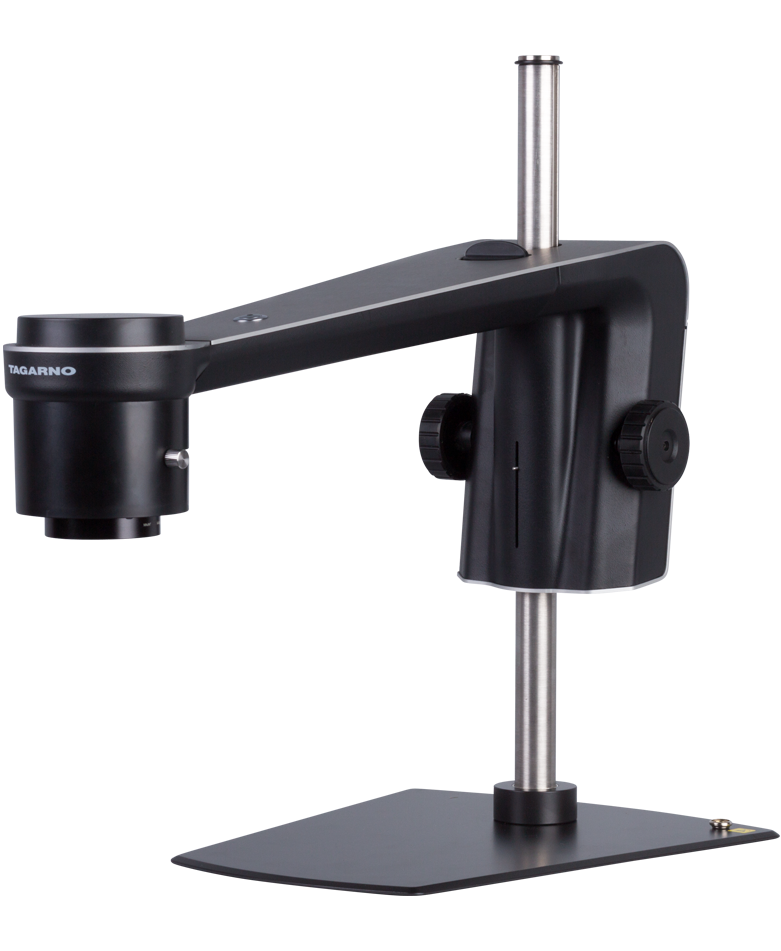
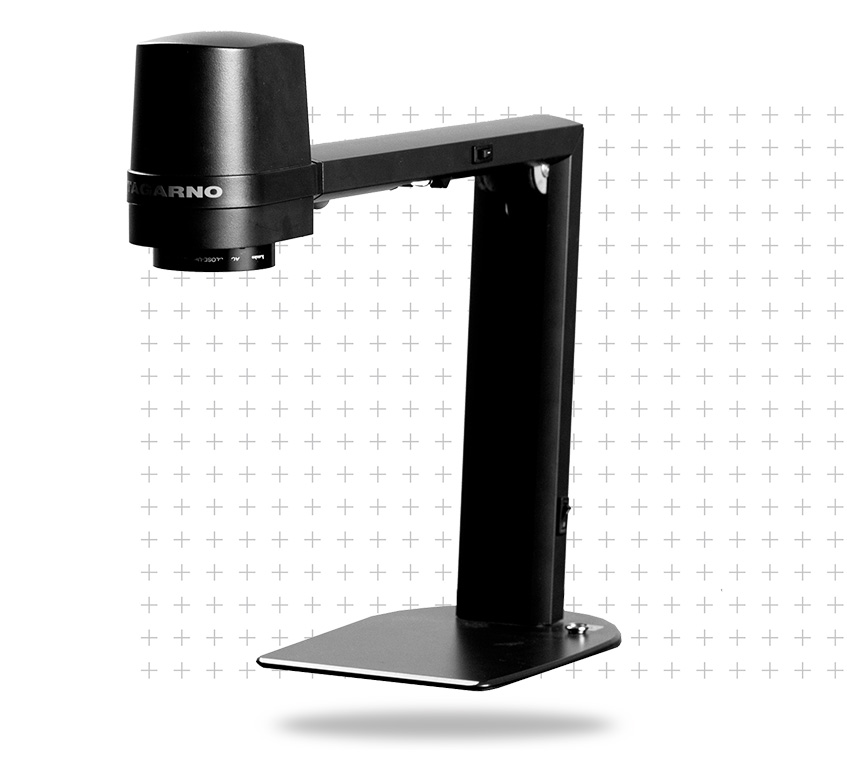
The microscopic tool you didn't know you couldn't live without
Designed with flexibility and speed in mind, the ZIP offers high-definition magnification, a generous working distance, fast autofocus, and seamless image capture capabilities – all in a compact footprint ideal for on-the-go professionals and agile labs.
What’s next for Forensic Eyes and your use of microscopy tools like the ZIP?
We’re continuing to expand our consultancy and training services, and tools like the ZIP will be at the heart of that growth. As the complexity of electronic systems increases, being able to clearly explain microscopic issues to diverse audiences becomes even more critical. We’re excited to keep pushing the boundaries of how microscopy supports collaboration, insight, and innovation. TAGARNO is a key part of that journey.
Let's discuss your needs
Do you want to know more about the difference the TAGARNO ZIP can make for your business? We're here to help!
Fill out contact form via the button below and we'll put you in contact with one of our experts. They'll be able to guide you through your specific inspection needs and show you how the microscopes work, either via an online or in-person demo.